
Development & debugging techniques
The tools and workflows for investigating rippled behaviour — standalone mode, logging, gdb, and inspecting ledgers and transactions.
What you'll learn
- Drive rippled in standalone mode for deterministic testing.
- Configure log partitions and levels.
- Use gdb and log analysis to investigate transaction processing.
Introduction
≈60 min · Intermediate · builds on The complete transaction lifecycle
Reading code only takes you so far, sooner or later you'll want to watch rippled actually run. In this module you'll pick up the tools that make that possible: standalone mode for deterministic, offline testing, the logging system with its partitions and severity levels, and gdb for stepping through the C++. These are the instruments you'll reach for every time something doesn't behave the way you expect.
Logging System
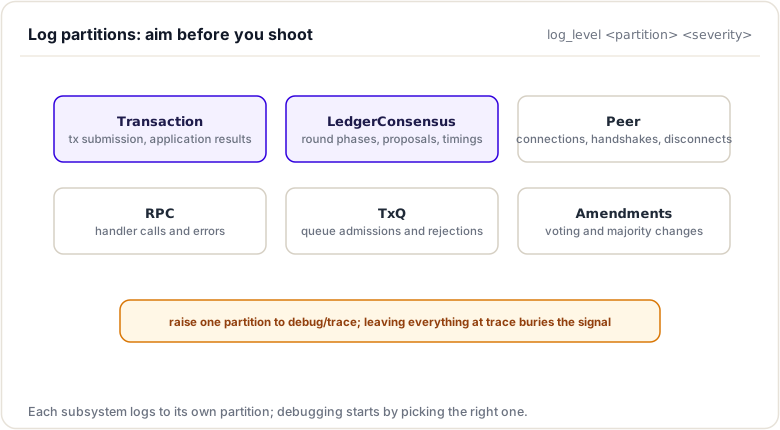
In brief: partitions and severity levels let you turn up detail on exactly the subsystem you are investigating.
Overview
Rippled includes a sophisticated logging system that provides detailed visibility into system behavior. Understanding how to configure and use logging effectively is the foundation of debugging Rippled.
Log Structure
Partitions: Logs are organized by subsystem (partition) Severity Levels: Each log entry has a severity level Timestamps: All logs include precise timestamps Context: Logs include relevant context (account IDs, ledger numbers, etc.)
Severity Levels
From most to least verbose:
trace   - Extremely detailed, every function call
debug   - Detailed debugging information
info    - General informational messages
warning - Warning conditions
error   - Error conditions
fatal   - Fatal errors that cause termination
Usage Guidelines:
- Production: Use
warningorerrorto minimize disk I/O - Development: Use
debugortracefor active debugging - Investigation: Temporarily enable
tracefor specific partitions
Log Partitions
Major subsystems have their own partitions:
Ledger              - Ledger operations
LedgerMaster        - Ledger master coordination
Transaction         - Transaction processing
Consensus           - Consensus rounds
Overlay             - P2P networking
Peer                - Individual peer connections
Protocol            - Protocol message handling
RPC                 - RPC request handling
JobQueue            - Job queue operations
NodeObject          - NodeStore operations
Application         - Application lifecycle
OrderBookDB         - Order book database
PathRequest         - Path finding
ValidatorList       - Validator list management
Amendments          - Amendment processing
Configuring Logging
In Configuration File
Edit xrpld.cfg:
[rpc_startup]
{ "command": "log_level", "severity": "warning" }
{ "command": "log_level", "partition": "Transaction", "severity": "trace" }
{ "command": "log_level", "partition": "Consensus", "severity": "debug" }
Via RPC Command
Dynamic adjustment without restart:
# Set all partitions to warning
xrpld log_level warning

# Set specific partition to trace
xrpld log_level Transaction trace

# Set multiple partitions
xrpld log_level Consensus debug
xrpld log_level Overlay debug
xrpld log_level Peer trace
Programmatically
In code:
// Get logger for this partition
beast::Journal j = app_.journal("MyComponent");

// Log at different levels
JLOG(j.trace()) << "Entering function with param: " << param;
JLOG(j.debug()) << "Processing transaction: " << tx.getTransactionID();
JLOG(j.info()) << "Ledger closed: " << ledger.seq();
JLOG(j.warning()) << "Unusual condition detected";
JLOG(j.error()) << "Failed to process: " << error;
JLOG(j.fatal()) << "Critical error, shutting down";
Log File Location
Default Locations:
- Linux:
/var/log/rippled/debug.log - macOS:
~/Library/Application Support/rippled/debug.log - Custom: Set in
xrpld.cfg:
[debug_logfile]
/path/to/custom/debug.log
Log Rotation
Configure log rotation to prevent disk space issues:
[debug_logfile]
/var/log/rippled/debug.log

# Rotate when file reaches 100MB
# Keep 10 old log files
Using system tools (Linux):
# /etc/logrotate.d/rippled
/var/log/rippled/debug.log {
    daily
    rotate 7
    compress
    delaycompress
    missingok
    notifempty
    copytruncate
}
Reading Log Files
Tail Live Logs:
tail -f /var/log/rippled/debug.log
Filter by Partition:
grep "Transaction:" /var/log/rippled/debug.log
Filter by Severity:
grep "ERR" /var/log/rippled/debug.log
Timestamp Range:
# Logs between specific times
awk '/2025-01-15 10:00/,/2025-01-15 11:00/' /var/log/rippled/debug.log
Common Patterns:
# Find transaction processing
grep "Transaction.*tesSUCCESS" /var/log/rippled/debug.log

# Find consensus rounds
grep "Consensus.*Starting round" /var/log/rippled/debug.log

# Find peer connections
grep "Overlay.*Connected to peer" /var/log/rippled/debug.log

# Find errors
grep -E "ERROR|ERR|Fatal" /var/log/rippled/debug.log
Standalone Mode
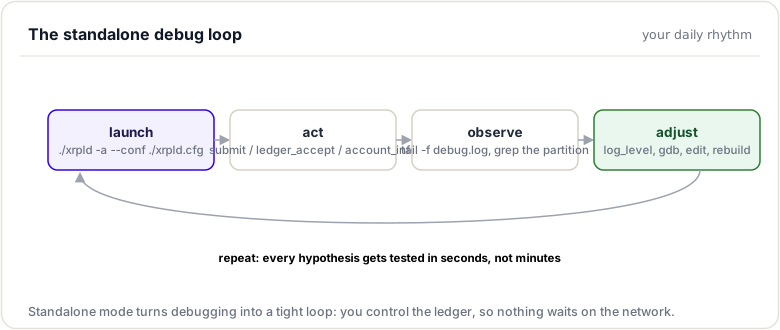
In brief: a deterministic, offline node where you control when ledgers close, ideal for reproducing bugs.
What is Standalone Mode?
Standalone mode runs Rippled as a single-node network where you have complete control:
- No peers: Runs without connecting to other nodes
- Manual ledger close: You trigger ledger closes
- Deterministic: No network randomness
- Fast: No consensus delays
- Isolated: Perfect for testing
Starting Standalone Mode
xrpld --standalone --conf=/path/to/xrpld.cfg
Configuration for Standalone:
[server]
port_rpc_admin_local
port_ws_admin_local

[port_rpc_admin_local]
port = 5005
ip = 127.0.0.1
admin = 127.0.0.1
protocol = http

[port_ws_admin_local]
port = 6006
ip = 127.0.0.1
admin = 127.0.0.1
protocol = ws

# No peer port needed in standalone

[node_db]
type=NuDB
path=/var/lib/rippled/standalone/db

[database_path]
/var/lib/rippled/standalone
Using Standalone Mode
Check Status:
xrpld server_info
Look for:
{
  "result": {
    "info": {
      "build_version": "3.2.0",
      "complete_ledgers": "1-5",
      "peers": 0,
      "server_state": "proposing",
      "standalone": true
    }
  }
}
Submit Transaction:
xrpld submit '{
  "TransactionType": "Payment",
  "Account": "rN7n7otQDd6FczFgLdlqtyMVrn3HMtthca",
  "Destination": "rLNaPoKeeBjZe2qs6x52yVPZpZ8td4dc6w",
  "Amount": "1000000",
  "Fee": "12",
  "Sequence": 1
}'
Manually Close Ledger:
xrpld ledger_accept
This immediately closes the current ledger and advances to the next one.
Check Transaction:
xrpld tx <hash>
Standalone Mode Workflow
# 1. Start standalone
xrpld --standalone --conf=standalone.cfg

# 2. Fund accounts (in another terminal)
xrpld wallet_propose

# 3. Submit transactions
xrpld submit <signed_tx>

# 4. Close ledger to include transaction
xrpld ledger_accept

# 5. Verify transaction
xrpld tx <hash>

# 6. Repeat steps 3-5 as needed
Advantages for Debugging
Deterministic Behavior:
- No network randomness
- Repeatable tests
- Predictable timing
Complete Control:
- Manual ledger progression
- No unexpected transactions
- Isolated environment
Fast Iteration:
- Instant ledger closes
- No waiting for consensus
- Quick test cycles
Safe Experimentation:
- Can't affect mainnet
- Easy to reset (delete database)
- Test dangerous operations safely
Key idea. Standalone mode is your lab. Because you close ledgers by hand and there is no network, the same inputs always produce the same outputs, which is what makes bugs reproducible.
GDB Debugging
In brief: attach and step through the C++ to see what the node is really doing.
Setting Up GDB
Install GDB:
# Linux
sudo apt-get install gdb

# macOS
brew install gdb
Compile with Debug Symbols:
cd rippled/build
cmake -DCMAKE_BUILD_TYPE=Debug ..
cmake --build . --target xrpld
Launch with GDB:
gdb --args ./xrpld --conf=/path/to/xrpld.cfg --standalone
Basic GDB Commands
Starting:
(gdb) run                    # Start program
(gdb) start                  # Start and break at main()
Breakpoints:
(gdb) break Payment.cpp:123  # Break at file:line
(gdb) break Payment::doApply # Break at function
(gdb) break xrpl::Transactor::apply   # Break at method (file:function is not valid gdb syntax)

(gdb) info breakpoints       # List all breakpoints
(gdb) delete 1               # Delete breakpoint #1
(gdb) disable 2              # Disable breakpoint #2
Execution Control:
(gdb) continue               # Continue execution
(gdb) next                   # Step over (one line)
(gdb) step                   # Step into (enter function)
(gdb) finish                 # Run until current function returns
Inspection:
(gdb) print variable         # Print variable value
(gdb) print *pointer         # Dereference pointer
(gdb) print object.method()  # Call method

(gdb) backtrace              # Show call stack
(gdb) frame 3                # Switch to frame #3
(gdb) info locals            # Show local variables
Advanced:
(gdb) watch variable         # Break when variable changes
(gdb) condition 1 i == 5     # Conditional breakpoint
(gdb) commands 1             # Execute commands at breakpoint
Debugging Transaction Processing
Example Session:
# Start GDB with rippled
gdb --args ./xrpld --standalone --conf=standalone.cfg

# Set breakpoints
(gdb) break Payment::doApply
(gdb) break Transactor::apply
(gdb) break NetworkOPs::processTransaction

# Run
(gdb) run

# In another terminal, submit transaction
$ xrpld submit <signed_tx>

# GDB will break at processTransaction
(gdb) backtrace
#0  NetworkOPs::processTransaction
#1  RPCHandler::doCommand
#2  ...

# Step through
(gdb) next
(gdb) next

# Examine transaction
(gdb) print transaction->getTransactionID()
(gdb) print transaction->getFieldAmount(sfAmount)

# Continue to Payment::doApply
(gdb) continue

# Examine state
(gdb) print accountID_
(gdb) print ctx_.tx[sfDestination]
(gdb) print view().read(keylet::account(accountID_))

# Step through payment logic
(gdb) step
(gdb) next

# Check result
(gdb) print result
(gdb) continue
Debugging Consensus
# Set breakpoints in consensus
(gdb) break RCLConsensus::startRound
(gdb) break Consensus::propose
(gdb) break Consensus::peerProposal

# Run
(gdb) run

# When consensus starts
(gdb) print prevLedgerHash
(gdb) print transactions.size()
(gdb) backtrace

# Step through proposal creation
(gdb) step
(gdb) print position_

# Continue to peer proposal handling
(gdb) continue
(gdb) print proposal.position()
(gdb) print peerID
Debugging Crashes
Core Dumps:
Enable core dumps:
ulimit -c unlimited
Run program until crash:
./xrpld --standalone --conf=standalone.cfg
# ... crash occurs
Analyze core dump:
gdb ./xrpld core
(gdb) backtrace
(gdb) frame 0
(gdb) info locals
Common Crash Patterns:
# Null pointer dereference
(gdb) print pointer
$1 = 0x0
(gdb) backtrace
# Look for where pointer should have been set

# Segmentation fault
(gdb) print array[index]
# Check if index is out of bounds

# Assert failure
(gdb) backtrace
# Look at assertion condition and surrounding code
Log Analysis and Interpretation
Transaction Logs
Successful Payment:
2025-01-15 10:23:45.123 Transaction:DBG Transaction E08D6E9754... submitted
2025-01-15 10:23:45.125 Transaction:TRC Preflight check passed
2025-01-15 10:23:45.126 Transaction:TRC Preclaim check passed
2025-01-15 10:23:45.127 Transaction:DBG Applied to open ledger: tesSUCCESS
2025-01-15 10:23:45.128 Overlay:TRC Relaying transaction to 18 peers
2025-01-15 10:23:50.234 Consensus:DBG Transaction included in consensus set
2025-01-15 10:23:50.456 Transaction:INF Applied to ledger 75234567: tesSUCCESS
Failed Payment:
2025-01-15 10:23:45.123 Transaction:DBG Transaction E08D6E9754... submitted
2025-01-15 10:23:45.125 Transaction:TRC Preflight check passed
2025-01-15 10:23:45.126 Transaction:WRN Preclaim check failed: tecUNFUNDED
2025-01-15 10:23:45.127 Transaction:DBG Rejected: insufficient funds
Consensus Logs
Normal Consensus Round:
2025-01-15 10:23:50.000 Consensus:INF Starting consensus round
2025-01-15 10:23:50.001 Consensus:DBG Building initial position: 147 transactions
2025-01-15 10:23:50.010 Consensus:TRC Proposal sent: hash=ABC123...
2025-01-15 10:23:52.123 Consensus:TRC Received proposal from nHU...: 145 txns
2025-01-15 10:23:52.125 Consensus:TRC Received proposal from nHB...: 146 txns
2025-01-15 10:23:52.500 Consensus:DBG Agreement: 145/147 transactions (98%)
2025-01-15 10:23:52.501 Consensus:INF Consensus reached on transaction set
2025-01-15 10:23:52.600 LedgerMaster:INF Ledger 75234567 closed
2025-01-15 10:23:54.000 LedgerMaster:INF Ledger 75234567 validated with 28/35 validations
Disputed Transaction:
2025-01-15 10:23:50.000 Consensus:INF Starting consensus round
2025-01-15 10:23:52.123 Consensus:DBG Transaction TX123 agreement: 65%
2025-01-15 10:23:54.456 Consensus:DBG Transaction TX123 agreement: 75%
2025-01-15 10:23:56.789 Consensus:WRN Transaction TX123 not included: only 75% agreement
2025-01-15 10:23:56.790 Consensus:INF Consensus reached on transaction set (TX123 excluded)
Network Logs
Peer Connection:
2025-01-15 10:23:45.123 Overlay:INF Connecting to r.ripple.com:51235
2025-01-15 10:23:45.234 Overlay:DBG TCP connection established
2025-01-15 10:23:45.345 Overlay:TRC TLS handshake complete
2025-01-15 10:23:45.456 Overlay:TRC Protocol handshake: version 2, node nHU...
2025-01-15 10:23:45.567 Overlay:INF Connected to peer nHU... (validator)
2025-01-15 10:23:45.568 Peer:DBG Added to active peers (18/20)
Connection Failure:
2025-01-15 10:23:45.123 Overlay:INF Connecting to bad-peer.example.com:51235
2025-01-15 10:23:50.123 Overlay:WRN Connection timeout
2025-01-15 10:23:50.124 Overlay:DBG Scheduling reconnect in 10 seconds
Performance Logs
Slow Ledger Close:
2025-01-15 10:23:50.000 LedgerMaster:INF Closing ledger 75234567
2025-01-15 10:23:55.000 LedgerMaster:WRN Ledger close took 5000ms (expected <2000ms)
2025-01-15 10:23:55.001 Transaction:WRN Applied 500 transactions in 4800ms
2025-01-15 10:23:55.002 OrderBookDB:WRN Order book update took 1200ms
Performance Profiling
In brief: find where time and memory actually go under load.
CPU Profiling
Using perf (Linux):
# Record profile while running
perf record -g ./xrpld --standalone --conf=standalone.cfg

# Generate report
perf report

# Generate flamegraph
perf script | stackcollapse-perf.pl | flamegraph.pl > rippled.svg
Using Instruments (macOS):
# Launch with Instruments
instruments -t "Time Profiler" ./xrpld --standalone --conf=standalone.cfg
Interpreting Results:
Look for:
- Hot functions (high CPU usage)
- Unexpected call patterns
- Inefficient algorithms
- Lock contention
Memory Profiling
Using Valgrind:
# Memory leak detection
valgrind --leak-check=full ./xrpld --standalone --conf=standalone.cfg

# Memory profiler
valgrind --tool=massif ./xrpld --standalone --conf=standalone.cfg
ms_print massif.out.12345
Using AddressSanitizer:
# Compile with sanitizer
cmake -DCMAKE_BUILD_TYPE=Debug \
      -DCMAKE_CXX_FLAGS="-fsanitize=address" ..
cmake --build . --target xrpld

# Run (crashes on memory errors)
./xrpld --standalone --conf=standalone.cfg
Network Profiling
Wireshark:
# Capture traffic
sudo tcpdump -i any port 51235 -w rippled.pcap

# Analyze with Wireshark
wireshark rippled.pcap
Filter by:
- Protocol messages
- Connection handshakes
- Bandwidth usage
Measuring Latency:
# Ping peer
xrpld ping <peer_ip>

# Check peer latency
xrpld peers | grep latency
Testing Strategies
Unit Testing
Run All Tests:
./xrpld --unittest
Run Specific Test Suite:
./xrpld --unittest=Payment
./xrpld --unittest=Consensus
Run with Verbose Output:
./xrpld --unittest --unittest-log
Writing Tests:
#include <test/jtx.h>

namespace xrpl {
namespace test {

class MyTest_test : public beast::unit_test::suite
{
public:
    void testBasicOperation()
    {
        using namespace jtx;

        // Create test environment
        Env env(*this);

        // Create accounts
        Account alice{"alice"};
        Account bob{"bob"};
        env.fund(XRP(10000), alice, bob);

        // Test operation
        env(pay(alice, bob, XRP(100)));
        env.close();

        // Verify result
        BEAST_EXPECT(env.balance(bob) == XRP(10100));
    }

    void run() override
    {
        testBasicOperation();
    }
};

BEAST_DEFINE_TESTSUITE(MyTest, app, xrpl);

} // namespace test
} // namespace xrpl
Integration Testing
Test Network Setup:
# Start multiple rippled instances
./xrpld --conf=node1.cfg &
./xrpld --conf=node2.cfg &
./xrpld --conf=node3.cfg &

# Configure them to peer
xrpld --conf=node1.cfg connect localhost:51236
xrpld --conf=node2.cfg connect localhost:51237
Test Scenarios:
- Multi-node consensus
- Network partitions
- Peer discovery
- Transaction propagation
Common Debugging Scenarios
Scenario 1: Transaction Not Validating
Symptoms: Transaction stuck in pending state
Debug Steps:
- Check transaction status:
xrpld tx <hash>
- Check for sequence gaps:
xrpld account_info <account>
# Compare Sequence with expected
- Check logs for rejection:
grep "<hash>" /var/log/rippled/debug.log
- Verify fee is sufficient:
xrpld server_info | grep "load_factor"
# Fee should be baseFee * loadFactor
- Check LastLedgerSequence:
xrpld ledger_current
# Compare with transaction's LastLedgerSequence
Scenario 2: Consensus Not Progressing
Symptoms: Ledger not closing, network stalled
Debug Steps:
- Check validator connectivity:
xrpld validators
- Examine consensus logs:
xrpld log_level Consensus trace
tail -f /var/log/rippled/debug.log | grep Consensus
- Check network connectivity:
xrpld peers
# Verify connected to enough peers
- Look for disputes:
grep "dispute" /var/log/rippled/debug.log
Scenario 3: High Memory Usage
Symptoms: Rippled consuming excessive memory
Debug Steps:
- Check ledger history:
xrpld server_info | grep "complete_ledgers"
- Review configuration:
[node_db]
cache_mb=256  # Reduce if too high
- Profile memory usage:
valgrind --tool=massif ./xrpld --standalone
ms_print massif.out.12345
- Check for leaks:
valgrind --leak-check=full ./xrpld --standalone
Scenario 4: Slow Ledger Closes
Symptoms: Ledgers taking >5 seconds to close
Debug Steps:
- Enable performance logging:
xrpld log_level LedgerMaster debug
xrpld log_level Transaction debug
- Check transaction count:
grep "Applied.*transactions" /var/log/rippled/debug.log
- Profile CPU usage:
perf record -g ./xrpld
perf report
- Check database performance:
# Check NodeStore backend performance
grep "NodeStore" /var/log/rippled/debug.log
Configure logging
cat > standalone.cfg << EOF [server] port_rpc_admin_local
[port_rpc_admin_local] port = 5005 ip = 127.0.0.1 admin = 127.0.0.1 protocol = http
[node_db] type=NuDB path=/tmp/rippled_debug
[database_path] /tmp/rippled_debug
[rpc_startup] { "command": "log_level", "severity": "debug" } { "command": "log_level", "partition": "Transaction", "severity": "trace" } EOF
Start
xrpld --standalone --conf=standalone.cfg
**Step 2**: Create test scenario with intentional issue

```javascript
// Create underfunded transaction
const tx = {
  TransactionType: 'Payment',
  Account: 'rN7n7otQDd6FczFgLdlqtyMVrn3HMtthca',
  Destination: 'rLNaPoKeeBjZe2qs6x52yVPZpZ8td4dc6w',
  Amount: '999999999999',  // More than account has
  Fee: '12',
  Sequence: 1
};
Part 2: Debugging Process
Step 3: Submit and observe failure
xrpld submit <signed_tx>
Step 4: Examine logs
tail -100 /var/log/rippled/debug.log | grep Transaction
Look for:
Transaction:TRC Preflight check: passed
Transaction:TRC Preclaim check: failed - tecUNFUNDED_PAYMENT
Transaction:DBG Rejected transaction: insufficient funds
Step 5: Verify balance
xrpld account_info rN7n7otQDd6FczFgLdlqtyMVrn3HMtthca
Step 6: Calculate required amount
const balance = accountInfo.account_data.Balance;
const reserve = 20000000; // Base reserve
const available = balance - reserve;
console.log(`Available: ${available} drops`);
console.log(`Requested: 999999999999 drops`);
console.log(`Shortfall: ${999999999999 - available} drops`);
Step 7: Fix and resubmit
// Corrected transaction
const fixedTx = {
  ...tx,
  Amount: String(available - 12)  // Account for fee
};
Part 3: Advanced Debugging
Step 8: Debug with GDB
# Recompile with debug symbols
cd rippled/build
cmake -DCMAKE_BUILD_TYPE=Debug ..
make

# Start with GDB
gdb --args ./xrpld --standalone --conf=standalone.cfg
Step 9: Set breakpoints
(gdb) break Payment::preclaim
(gdb) run
Step 10: Submit transaction (in another terminal)
xrpld submit <signed_tx>
Step 11: Examine state in GDB
# Breakpoint hit
(gdb) print ctx.tx[sfAmount]
(gdb) print (*sleAccount)[sfBalance]
(gdb) print fee
(gdb) print balance < (amount + fee)
# Should be true, causing tecUNFUNDED

(gdb) continue
Analysis Questions
- What error code was returned?
- tecUNFUNDED_PAYMENT
- At which validation phase did it fail?
- Preclaim (ledger state check)
- What was the root cause?
- Insufficient balance for payment + fee + reserve
- How would you prevent this in client code?
- Check balance before submitting
- Account for reserve requirements
- Include fee in calculation
- What logs helped identify the issue?
- Transaction partition trace logs
- Preclaim failure message
Additional Resources
Official Documentation
- XRP Ledger Dev Portal: xrpl.org/docs
- Rippled Repository: github.com/XRPLF/rippled
- Build Instructions: github.com/XRPLF/rippled/blob/develop/BUILD.md
Debugging Resources
- GDB Documentation: sourceware.org/gdb/documentation
- Valgrind Manual: valgrind.org/docs/manual
- Linux Perf Wiki: perf.wiki.kernel.org
Codebase References
src/libxrpl/core/detail/JobQueue.cpp- Job queue debuggingsrc/xrpld/app/main/Application.cpp- Application startup debuggingsrc/test- Unit test examples
Related Topics
- Application Layer - Understanding system architecture
- Transaction Lifecycle - Understanding transaction flow
- Codebase Navigation - Finding code to debug
Summary
This module equipped you to watch rippled run. You learned to use standalone mode for deterministic, reproducible testing, to configure the logging system by partition and severity, and to step through the C++ with gdb. The habit to take away: reach for logs first, reproduce reliably in standalone mode, narrow to a single component, and let the logs point you into the code.
To remember:
- Standalone mode (
./xrpld -a) is your lab: you close ledgers manually, so runs are deterministic and reproducible - Severity ladder: trace < debug < info < warning < error < fatal
- Change verbosity at runtime:
log_level <partition> <level>; useful partitions:TxQ,LedgerConsensus,Overlay,Transaction - gdb workflow: Debug build,
gdb --args ./xrpld -a --conf xrpld.cfg, break on e.g.Payment::doApply get_counts(admin) dumps object counts and cache statistics- Logging code:
include/xrpl/basics/Log.h; theJLOGmacro is everywhere - Reach for logs first, the debugger second; reproduce in standalone before anything else
- Watch out: trace level on ALL partitions drowns you and slows the node; always scope the partition
Next up. You can watch your own node think. But what is it saying to the other nodes? Next up, the binary vocabulary of the network: protocols and wire messages.
Resources
Assignments
0 of 2 complete