
Caching & resource management
The cache layer that keeps hot nodes in memory, and the memory / disk / throughput characteristics of a production node.
What you'll learn
- Explain the multi-tier caching and the cache-hit path.
- Reason about memory, disk and write-throughput budgets.
- Tune cache size and age for different deployments.
Introduction
≈60 min · Advanced · builds on Storage backends & database operations
Disk is slow, and a busy node can't afford to hit it for every lookup, so it caches aggressively. In this module you'll learn the multi-tier caching that keeps hot nodes in memory, how the TaggedCache decides what to keep and evict, and how to reason about a node's memory, disk and throughput budgets. It's the difference between a node that keeps up and one that falls behind.
The Performance Problem
In brief: hitting disk for every node lookup would be far too slow, so hot nodes stay in memory.
Scenario: Synchronizing from the Network
A new node joins XRPL and must catch up to current ledger. This requires:
- Fetching missing ledgers (blocks of transactions)
- For each ledger, fetching all state nodes
- Verifying each node's hash
- Storing nodes to disk
Naive Approach (No Cache):
for (each node in ledger) {
    backend.fetch(nodeHash);  // Database query - 10ms
}

For 10,000 nodes in ledger:
  10,000 × 10ms = 100 seconds per ledger

For 100,000 ledgers to catch up:
  100 seconds × 100,000 = 1,157 days
Clearly infeasible.
With Caching (90% Hit Rate):
for (each node in ledger) {
    if (cache.has(nodeHash)) {
        cache.get(nodeHash);      // 10 microseconds
    } else {
        backend.fetch(nodeHash);  // 10 milliseconds
    }
}

For 10,000 nodes:
  9,000 × 10µs (cache hits) = 90ms
  1,000 × 10ms (cache misses) = 10,000ms
  Total: 10,090ms ≈ 10 seconds per ledger

For 100,000 ledgers:
  100,000 × 10 seconds = 1,000,000 seconds ≈ 11.5 days
Still slow, but realistic with parallel processing.
The difference between possible and impossible is caching.
Key idea. A cache hit serves a node straight from memory with no disk read. Cache hit-rate is one of the biggest levers on a node's real-world performance.
TaggedCache Architecture
In brief: the cache that holds nodes by hash and sweeps them out by age.
The NodeStore's primary cache is the TaggedCache:
Purpose:
class TaggedCache {
    // Keep frequently accessed NodeObjects in memory
    // Minimize expensive database queries
    // Provide thread-safe concurrent access
};
Structure:
class TaggedCache {
private:
    // Key: NodeObject hash (uint256)
    // Value: shared_ptr<NodeObject>
    std::unordered_map<uint256, std::shared_ptr<NodeObject>> mCache;

    // Protect concurrent access
    std::mutex mLock;

    // Configuration
    size_t mMaxSize;        // Maximum objects in cache
    std::chrono::seconds mMaxAge;  // Maximum age before eviction
};

public:
    // Retrieve from cache
    std::shared_ptr<NodeObject> get(uint256 const& hash);

    // Store in cache
    void insert(uint256 const& hash,
               std::shared_ptr<NodeObject> const& obj);

    // Remove from cache
    void remove(uint256 const& hash);

    // Evict old entries
    void evictExpired();
};
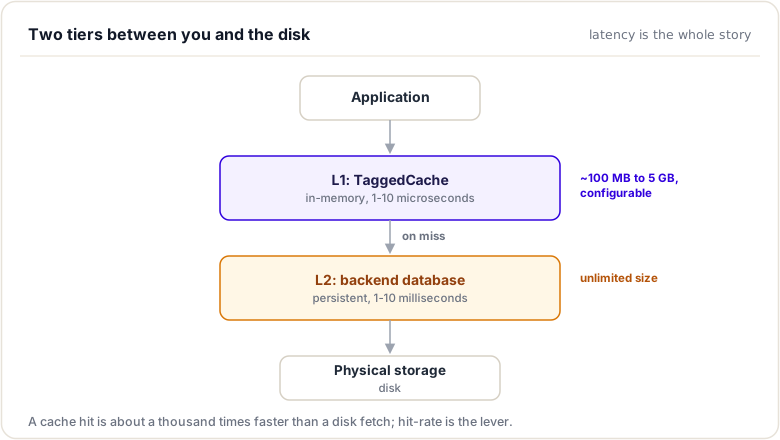
Cache Tiers:
NodeStore implements a two-tier caching strategy:
Fetch Algorithm:
std::shared_ptr<NodeObject> fetch(uint256 const& hash) {
    // Step 1: Check cache
    {
        std::lock_guard<std::mutex> lock(mCacheLock);
        auto it = mCache.find(hash);
        if (it != mCache.end()) {
            // Found in cache
            recordHit(hash);
            return it->second;
        }
    }

    // Step 2: Cache miss - query backend
    auto obj = backend->fetch(hash);
    if (!obj) {
        // Object not found anywhere
        // Cache a dummy marker to prevent repeated lookups
        cacheDummy(hash);
        return nullptr;
    }

    // Step 3: Update cache with newly fetched object
    {
        std::lock_guard<std::mutex> lock(mCacheLock);
        mCache.insert({hash, obj});
    }

    recordMiss(hash);
    return obj;
}
Cache Insertion Strategy
When Objects Enter Cache:
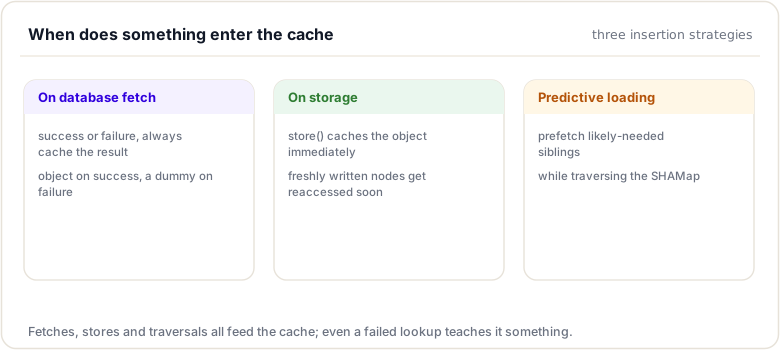
Dummy Objects:
Special marker objects prevent wasted lookups:
class NodeObject {
    static std::shared_ptr<NodeObject> createDummy(uint256 const& hash) {
        auto obj = std::make_shared<NodeObject>();
        obj->mType = NodeObjectType::Dummy;      // Type 512: marker
        obj->mHash = hash;
        obj->mData.clear();         // Empty data
        return obj;
    }

    bool isDummy() const {
        return mType == NodeObjectType::Dummy;
    }
};

// In fetch:
std::shared_ptr<NodeObject> backend_result = backend->fetch(hash);
if (!backend_result) {
    // Not found - cache dummy to avoid retry
    auto dummy = NodeObject::createDummy(hash);
    cache.insert(hash, dummy);
    return nullptr;
}
Benefit of Dummies:
Scenario: Syncing but peer doesn't have a node

Without dummies:
  Request node X from network
  Peer: "I don't have it"
  Local check: Try backend
  Backend: "Not there"
  (repeat this sequence multiple times)

With dummies:
  Request node X from network
  Peer: "I don't have it"
  Local check: Cache hit on dummy
  Immediately know: "Not available"
  Don't retry
Prevents thundering herd of repeated failed lookups.
Cache Eviction
In brief: how the cache decides what to drop when memory is tight.
Cache capacity is limited. When full, old objects must be evicted.
Eviction Triggers:
void insertWithEviction(uint256 const& hash,
                       std::shared_ptr<NodeObject> const& obj) {
    {
        std::lock_guard<std::mutex> lock(mCacheLock);

        // Check size limit
        if (mCache.size() >= mMaxSize) {
            evictLRU();  // Remove least recently used
        }

        mCache.insert({hash, obj});
    }

    // Check age limit (periodic)
    if (shouldEvictExpired()) {
        evictExpired();  // Remove objects older than mMaxAge
    }
}
LRU (Least Recently Used) Eviction:
void evictLRU() {
    // Find object with oldest access time
    auto oldest = findOldestAccess();

    // Remove from cache
    mCache.erase(oldest->hash);
}

// Track access times
struct CacheEntry {
    std::shared_ptr<NodeObject> object;
    std::chrono::steady_clock::time_point lastAccess;
};
Age-Based Eviction:
void evictExpired() {
    auto now = std::chrono::steady_clock::now();

    for (auto it = mCache.begin(); it != mCache.end();) {
        auto age = now - it->second.lastAccess;

        if (age > mMaxAge) {
            // Object too old - remove
            it = mCache.erase(it);
        } else {
            ++it;
        }
    }
}
Configuration Parameters:
// From xrpld.cfg
[node_db]
cache_size = 256        // MB
cache_age = 60          // seconds
Impact of Configuration:
Small cache:
  cache_size = 32 MB
  Hit rate: ~60% (more evictions)
  Disk queries: 40% of lookups (slower)

Large cache:
  cache_size = 1024 MB
  Hit rate: ~95% (fewer evictions)
  Disk queries: 5% of lookups (faster)
  Memory usage: Higher

Operators choose based on available RAM and performance needs
Cache Performance Metrics
NodeStore tracks cache effectiveness:
struct CacheMetrics {
    uint64_t hits;           // Cache hits
    uint64_t misses;         // Cache misses
    uint64_t inserts;        // Objects added
    uint64_t evictions;      // Objects removed

    double hitRate() const {
        return hits / (double)(hits + misses);
    }
};

// Typical production hit rates:
// Well-configured: 90-95%
// Poorly tuned: 60-75%
// Synchronized node: 98% (accessing recent ledgers)
Example Metrics:
From a running XRPL validator:

Period: 1 hour
Cache hits:     86,400  (hit on hot data)
Cache misses:    7,200  (query database)
Hit rate:       92.3%   (excellent)

Latency impact:
  Average: 0.92 * 1µs + 0.08 * 10ms = 0.81 milliseconds
  Without cache: Average 10 milliseconds
  Speedup: 12.3x

Throughput impact:
  Queries handled: 93,600 per hour
  If all disk: 360 per hour (would be ~260x slower)
  Caching enables actual performance
Synchronization Optimization
During network synchronization, special techniques optimize caching:
Prefetching
void synchronizeNode(SHAMapNodeID nodeID,
                    uint256 const& nodeHash) {
    // Fetch this node
    auto node = fetch(nodeHash);

    if (auto inner = dynamic_cast<SHAMapInnerNode*>(node)) {
        // This is an inner node
        // Likely next accesses are to its children
        // Prefetch children to warm cache
        for (int i = 0; i < 16; ++i) {
            uint256 childHash = inner->getChildHash(i);
            if (childHash.isValid()) {
                // Asynchronously prefetch
                asyncFetch(childHash);
            }
        }
    }
}
Batch Loading
// Fetch multiple nodes in single operation
std::vector<uint256> hashes = {hash1, hash2, hash3, ...};
auto results = backend->fetchBatch(hashes);

// Reduces backend overhead
// Populates cache efficiently
// Parallelizes I/O operations
Deferred Reads
// During synchronization, identify missing nodes
std::vector<uint256> missing = getMissingNodes(shamap);

// Request from peers asynchronously
// When they arrive, cache them
// Continue traversal without blocking on network

// This allows pipelining: request more while processing previous results
Working Set Management
Different phases of operation have different access patterns:
During Normal Operation (Steady State)
Access pattern: Recent ledgers frequently accessed
  Root hash: checked at consensus
  Recent state nodes: queried for transactions
  Old historical data: rarely accessed

Cache configuration:
  Keep recent ledgers fully cached
  Let old ledgers evict to make room
  Result: Excellent hit rate for current operations
During Synchronization
Access pattern: Missing nodes from network
  Need to verify hash chain from root to leaf
  Often fetching siblings (related nodes)
  May access same node multiple times

Cache strategy:
  Smaller cache acceptable (still beneficial)
  Prefetch siblings when fetching parent
  Use dummy markers to avoid retry storms
  Result: Synchronization completes in hours vs days
After Sync Completion
Access pattern: Back to steady-state recent ledger access

Cache characteristics:
  Most-accessed nodes pinned in cache
  Hit rate quickly reaches 90%+
  Warm cache from prior work
Thread Safety
In brief: how the cache stays correct while many threads read and write it.
Cache must be safe for concurrent access:
class TaggedCache {
    std::unordered_map<uint256, CacheEntry> mCache;
    mutable std::shared_mutex mLock;  // Allow multiple readers

public:
    std::shared_ptr<NodeObject> get(uint256 const& hash) {
        std::shared_lock<std::shared_mutex> lock(mLock);
        auto it = mCache.find(hash);
        return (it != mCache.end()) ? it->second.object : nullptr;
    }

    void insert(uint256 const& hash,
               std::shared_ptr<NodeObject> const& obj) {
        std::unique_lock<std::shared_mutex> lock(mLock);

        // Check if size exceeded
        if (mCache.size() >= mMaxSize) {
            evictLRU();  // Exclusive lock held, safe to modify
        }

        mCache[hash] = {obj, now()};
    }
};
Concurrency Properties:
Multiple readers:
  Many threads can fetch simultaneously
  No contention for cache hits
  Scaling: hundreds of concurrent fetches possible

Insert/evict operations:
  Exclusive lock for modification
  Short-lived (just map operations)
  Background eviction: doesn't block fetches
Advanced Caching: Full Below Optimization
During synchronization, special tracking prevents redundant work:
The Problem:
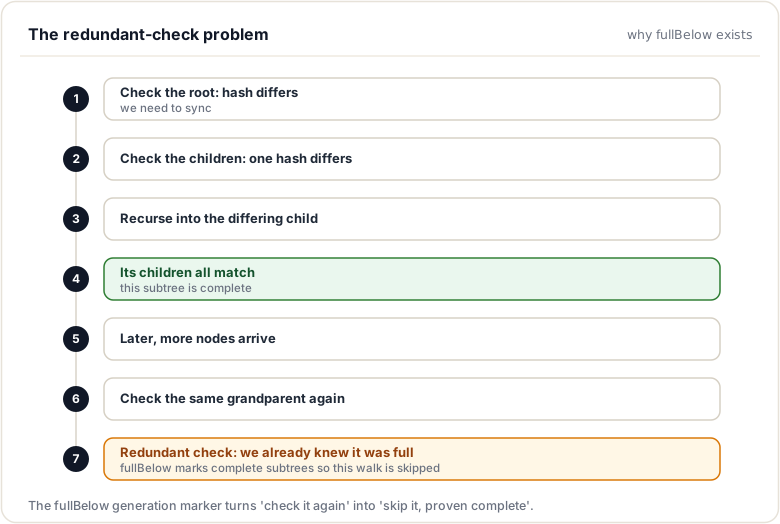
The Solution: Full Below Generation Counter
class SHAMapInnerNode {
    // Generation number marking when this node was verified complete
    std::uint32_t mFullBelow;
};

class FullBelowCache {
    // Current generation
    std::uint32_t mCurrentGeneration = 0;

    bool isKnownFull(SHAMapInnerNode* node) {
        return node->mFullBelow == mCurrentGeneration;
    }

    void markFull(SHAMapInnerNode* node) {
        node->mFullBelow = mCurrentGeneration;
    }

    void invalidate() {
        ++mCurrentGeneration;  // Invalidate all prior markings
    }
};
Benefit:
When synchronizing:
  Fetch subtree, verify all descendants present
  Mark as "full below" with generation ID
  Later sync process checks generation
  If matches current: skip this subtree (known complete)
  If differs: need to re-verify (new sync started)

Result: Avoids re-traversing known-complete subtrees
Significant speedup in incremental sync scenarios
Resource Management and Performance Characteristics
Introduction
Understanding SHAMap and NodeStore theoretically is one thing. Operating them in production is another.
This final chapter covers:
- Real-world resource requirements
- Performance measurement and optimization
- Bottleneck identification
- Tuning for different deployment scenarios
Lookup Complexity Analysis
SHAMap Lookup
Operation: Find account by ID

Worst case: O(64) node traversals
  Tree depth: 256 bits / 4 bits per level = 64 levels

Typical case: O(1)
  Most accounts found before depth 64
  Average depth in realistic ledger: ~25 levels

Expected time:
  Each traversal: O(1) array access (branch[0..15])
  Total: O(1) expected time (linear in actual tree size,
         but tree size ~ account count)

Cache hit: 1-10 microseconds
  Direct pointer access, no I/O

Cache miss: 1-10 milliseconds
  Database query required
Batch Fetch
N objects requested:

Naive (sequential):
  N × database_latency = N × 10ms
  Example: 100 objects = 1000ms

Batched:
  single_batch_latency + deserialize
  Example: 100 objects = 10ms + 5ms = 15ms
  Speedup: 66x
Write Throughput
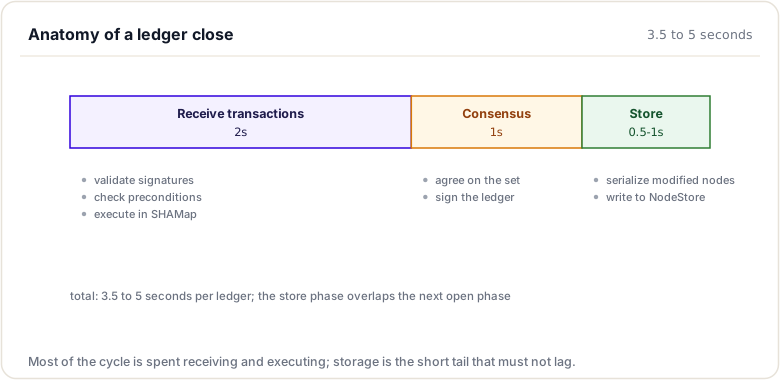
Ledger Close Cycle
Node Object Volume
Typical ledger modification:

200-400 transactions per ledger
  Average 2-4 modified accounts per transaction
  = 500-1000 modified nodes

Plus structural nodes (parent rehashing):
  Depth of modified accounts: ~25 levels
  = 25 ancestor nodes modified

Total objects created: ~600-1100 per ledger

At ~1 ledger every 3-4 seconds (~0.25-0.3 ledgers/second):
  ~150-330 objects/second

Database requirement:
  RocksDB: Handles 10,000-50,000 obj/sec easily
  NuDB:    Handles 50,000-200,000 obj/sec
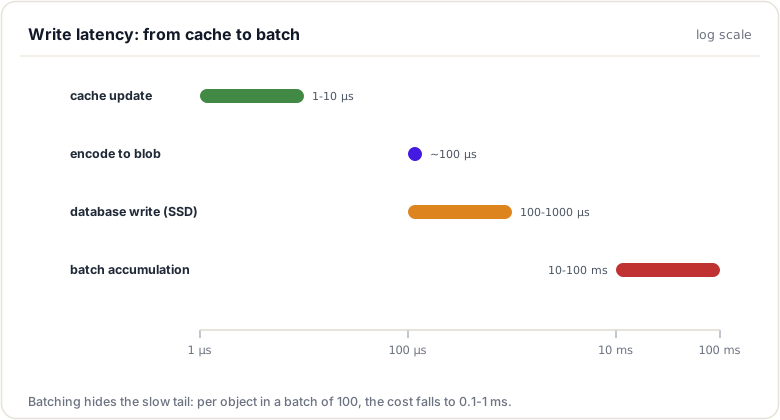
Write Latency
Read Performance Characteristics
Cache Hit Scenario
Hit rate: 95% (well-tuned system)

1000 object requests:
  950 cache hits × 5 microseconds = 4.75 milliseconds
  50 cache misses × 10 milliseconds = 500 milliseconds
  Total: 504.75 milliseconds = 0.5 seconds

Average per request: 0.5 milliseconds
Cache Miss Scenario
Hit rate: 60% (poorly tuned system)

1000 object requests:
  600 cache hits × 5 microseconds = 3 milliseconds
  400 cache misses × 10 milliseconds = 4000 milliseconds = 4 seconds
  Total: 4.003 seconds

Average per request: 4 milliseconds

10x slower due to cache misses!
Memory Requirements
NodeStore Memory
Cache layer:
  Size: Configurable (32MB - 4GB typical)
  Per object: ~100-500 bytes
  At 256MB cache: ~300,000-500,000 cached objects

Backend buffers:
  RocksDB: ~100-300MB for block cache
  NuDB: ~50-100MB

Thread pools:
  Each async thread: ~1-2MB stack
  10 threads: ~20MB

Total NodeStore memory: cache_size + backend_buffers + thread_stacks
  Typical: 256MB cache + 200MB backend = 500MB total
  Large: 1GB cache + 300MB backend = 1.3GB total
SHAMap Memory
In-memory tree of current + recent ledgers:

Active ledger: ~10-50MB
  Depends on account count and modification volume

Recent immutable ledgers (kept for quick access):
  2-3 most recent: ~30-150MB

Total SHAMap: 50-200MB typical

Plus cached nodes (shared with NodeStore cache):
  Counted above in NodeStore memory
Total Memory Budget
Minimal validator:
  SHAMap: 50MB
  NodeStore: 200MB
  Other rippled: 100MB
  Total: 350MB

Standard validator:
  SHAMap: 100MB
  NodeStore: 500MB
  Other rippled: 100MB
  Total: 700MB

Large validator:
  SHAMap: 200MB
  NodeStore: 2000MB
  Other rippled: 100MB
  Total: 2.3GB
Disk Space Requirements
Database Growth
Without rotation: Unbounded growth

Per ledger:
  ~600-1100 new objects per ledger
  ~200 bytes per object (with compression)
  = ~120-220KB per ledger

Per day:
  ~21,600 ledgers per day (one every ~4s)
  = ~2.4-4.4 GB per day

Per year:
  = ~876GB - 1.6TB per year

Clearly unsustainable (disk fills in weeks)
With Rotation
Retention policy: Keep last 100,000 ledgers

Ledger creation rate: 1 ledger per ~3 seconds
100,000 ledgers = ~8 days of history

Database size:
  100,000 × 0.2MB = 20GB (stable)
  With overhead: 30-50GB typical

Bounded growth enables indefinite operation
Actual Sizes on Mainnet
Small validator (RocksDB, compressed):
  Database: 30-50GB
  With binaries/logs: 60GB total

Archive node (full history):
  Database: 500GB-1TB
  With redundancy: 1.5TB total

Growth per day (with rotation):
  ~500MB-1GB per day
  (old data deleted as new data added)
File Descriptor Usage
File Descriptor Requirements
Each backend type requires different FDs:

RocksDB:
  - Main database: 1
  - WAL (write-ahead log): 1
  - SSTable files: 20-100 (per configuration)
  - Total: 25-100 FDs

NuDB:
  - Main data file: 1
  - Index file: 1
  - Total: 2-5 FDs

Operating system overhead:
  stdin, stdout, stderr: 3
  Socket listening: 2-5
  Network connections: ~50 typical

Total rippled process:
  - Without NodeStore: 50-100 FDs
  - With RocksDB: 100-200 FDs
  - Comfortable limit: 4096 FDs

Configuration:
  ulimit -n 4096    # Set FD limit
Performance Tuning
Identifying Bottlenecks
Monitor these metrics:
// Cache hit rate - most important
if (metrics.hitRate() < 90%) {
    // Increase cache_size
    problem = "Cache too small";
}

// Write latency - latency-sensitive
if (metrics.writeLatency > 100ms) {
    // Switch to faster backend or increase batch size
    problem = "Backend I/O too slow";
}

// Fetch latency
if (metrics.fetchLatency > 50ms) {
    // Check cache hit rate
    // Check disk health
    problem = "Database queries too slow";
}

// Async queue depth
if (metrics.asyncQueueDepth > 10000) {
    // Not keeping up with demand
    problem = "Async processing overwhelmed";
}
Tuning Parameters
[node_db]
type = RocksDB
path = /var/lib/rippled/db

# Cache tuning
cache_size = 256        # Increase if memory available
cache_age = 60          # Longer = better hit rate

# Threading
async_threads = 4       # Increase for I/O-bound systems

# Batch operations
batch_write_size = 256  # Larger batches, fewer transactions

# online_delete goes in the [node_db] section; it is a raw ledger count
online_delete = 256000  # Keep ~256K ledgers
Scenario 1: High-Traffic Validator
Problem: Write latency too high (ledgers close slowly)

Solution:
  - Increase cache_size to 1GB+
  - Switch to NuDB backend (higher throughput)
  - Increase async_threads to 8-16
  - Ensure SSD (not HDD)
  - Increase batch_write_size

Result: Write throughput 50K+ objects/sec
Scenario 2: Memory-Constrained
Problem: Only 512MB RAM available

Solution:
  - Set cache_size = 64MB (small)
  - Still runs, but slower
  - Increase cache_age for working set
  - Monitor hit rate (may drop to 80%)

Result: Functional but slower sync and queries
Scenario 3: Archive Node
Problem: Need complete history, very large disk

Solution:
  - No rotation (online_delete disabled)
  - RocksDB with compression
  - Smaller cache_size (less frequently accessed)
  - Parallel database with rotated copy

Result: Full history, terabyte+ database
Performance Characteristics Summary
Lookup Performance:
Single object lookup:
  Cache hit:    1-10 microseconds
  Cache miss:   1-10 milliseconds
  95% hit rate: ~0.5 milliseconds average

Batch operation (100 objects):
  Sequential:   1000 milliseconds
  Batched:      10 milliseconds
  Speedup:      100x
Write Performance:
Per ledger:
  1000 objects per ledger
  Per-object: 0.1-1 millisecond
  Batch overhead: 10-100 milliseconds
  Total per ledger: 100-1100 milliseconds

Throughput:
  4 ledgers/second × 1000 objects/ledger = 4000 obj/sec
  Well within RocksDB/NuDB capacity
Memory Usage:
Minimum:  200-300MB
Typical:  500-700MB
Large:    2-4GB
Depends on cache_size configuration
Disk Space:
With rotation:  30-50GB (8-10 days history)
Unbounded:      ~1TB per year (without rotation)
Growth rate:    ~500MB-1GB per day
Scalability Limits:
Current network:
  2000+ validators
  100-400 transactions/ledger
  Proven sustainable

Theoretical limits:
  Cache hit rate: 80%+ maintainable at any size
  Write throughput: 100K obj/sec possible
  Read throughput: 1M obj/sec with cache

Practical limits:
  Memory: 4-16GB per validator typical
  Disk: 100GB-1TB per validator typical
  Network: Synchronization limits transaction volume
  Consensus: Agreement time limits throughput
Monitoring in Production
Key Metrics to Track
1. Cache Statistics:
   - Hit rate (target: >90%)
   - Size (should be close to configured max)
   - Eviction rate

2. Database Performance:
   - Write latency (target: <100ms per ledger)
   - Read latency (target: <50ms per request)
   - Queue depth (target: <1000)

3. Resource Usage:
   - Memory (should stabilize)
   - CPU (typically 20-50% on modern systems)
   - Disk I/O (peaks during sync)

4. Application:
   - Ledger close time (target: 3-5 seconds)
   - Synchronization lag (target: 0 when caught up)
   - Block proposal success (target: >95%)
Alerting Thresholds
Warning:
  - Hit rate < 80%
  - Write latency > 200ms
  - Queue depth > 5000

Critical:
  - Hit rate < 60%
  - Write latency > 500ms
  - Ledger close > 10 seconds
  - Disk space < 10GB free
Summary
This module explained how a node stays fast under load. A multi-tier cache keeps hot nodes in memory so the node rarely touches disk; the TaggedCache holds them by hash and sweeps them out by age. You learned to reason about a node's memory, disk, and throughput budgets, and saw why cache hit-rate is one of the biggest levers on real-world performance.
To remember:
- TaggedCache: an in-memory, hash-keyed cache with age-based sweeping
- Cache hit = served from RAM; miss = NodeStore (disk) fetch, then insert
get_counts(admin) shows cache sizes and hit rates: measure before you tune- Tune size and age per deployment; a validator and a full-history node want different budgets
- The hot working set is the recent ledgers' nodes; sync workloads shift it
- fullBelow tracking marks complete subtrees during sync so they are not re-walked
- Cache hit-rate is one of the biggest real-world performance levers
- Watch out: a bigger cache is not free (RAM pressure, sweep cost); measure with
get_countsbefore and after
Next up. Storage is fast enough; time to spend that speed. Next phase of the machine: the transactor architecture, the framework every transaction type plugs into.
Resources
Assignments
0 of 2 complete