
Storage backends & database operations
The NodeStore backends (NuDB, RocksDB…) and the fetch / store / batch / async lifecycle above them.
What you'll learn
- Compare the NuDB and RocksDB backends.
- Trace fetch, store, batch and async operations.
- Understand online deletion / database rotation.
Introduction
≈60 min · Advanced · builds on NodeStore architecture
Watch this short video by XRPL Commons first, then dive into the details below.
Now that you know what the NodeStore stores, let's look at where and how. In this module you'll compare the real backends (NuDB and RocksDB) and trace the fetch, store, batch and async operations that move data in and out, plus online deletion, the mechanism that keeps a node's disk from growing forever. This is where architecture meets the realities of running a node.
Choosing a Backend at a Glance
In brief: NuDB versus RocksDB at a glance, and when to pick each.
RocksDB (Recommended)
When to use:
- General-purpose validators
- Balanced performance and simplicity
- Standard configurations
Configuration:
[node_db]
type = RocksDB
path = /data/rippled.db
cache_size = 256
Performance:
- Write throughput: 10,000-50,000 objects/sec
- Compression: 50-70% disk space savings
- Good for: Most deployments
NuDB (High-Performance)
When to use:
- High-transaction-volume networks
- Maximum write throughput needed
- Modern SSD storage
Configuration:
[node_db]
type = NuDB
path = /data/nudb
Performance:
- Write throughput: 50,000-200,000 objects/sec
- Optimized for: Sequential writes
- Good for: Archive nodes, heavily-used validators
Testing Backends
- Memory: In-memory, non-persistent (testing only)
- Null: No-op backend (unit tests)
Encoding Format Reference
The standardized encoding format enables backend independence:
Structure (from the NodeStore architecture module):
Bytes 0-7:   Reserved (set to zero)
Byte 8:      Type (NodeObjectType enumeration)
Bytes 9+:    Serialized data payload
This format is handled transparently by the Database layer, but understanding it is important for:
- Backend implementation
- Data corruption diagnosis
- Migration between backends
Configuration Tuning
In brief: the knobs that matter for a backend's memory and throughput.
RocksDB Options
[node_db]
type = RocksDB
path = /var/lib/rippled/db/rocksdb
cache_size = 256        # Cache size in MB
cache_age = 60          # Age limit in seconds

# Performance tuning
compression = true      # Enable compression
block_cache_size = 256  # Block cache in MB
write_buffer_size = 64  # Write buffer in MB
max_open_files = 100
NuDB Options
[node_db]
type = NuDB
path = /var/lib/rippled/db/nudb

# NuDB specific
key_size = 32           # Key size (always 32 for SHA256)
block_size = 4096       # Block size for writes
Migration Between Backends
In brief: how to move an existing node's data from one engine to another.
To migrate from one backend to another:
# 1. Stop the server
systemctl stop rippled

# 2. Export from current backend
xrpld --export current_db export.json

# 3. Update configuration
# Change [node_db] type in xrpld.cfg

# 4. Import to new backend
xrpld --import export.json --ledger-db new_db

# 5. Restart server
systemctl start rippled
For Detailed Reference
See these sections of the NodeStore architecture module:
- "Backend Abstraction" - Interface design
- "Supported Backends" - Feature comparison
- "Data Encoding Format" - Serialization details
For implementation details, consult:
rippled/include/xrpl/nodestore/Backend.hrippled/include/xrpl/nodestore/Database.hrippled/src/libxrpl/nodestore/backend/*Factory.cpp
Database Operations and Lifecycle Management
In brief: fetch, store, batch and async operations, plus online deletion.
Key idea. Online deletion (database rotation) is what keeps a node's disk bounded: it drops ledger history the node no longer needs to keep.
Introduction
Beyond the cache layer, the Database class orchestrates the complete lifecycle of NodeStore operations:
- Initialization on startup
- Runtime fetch/store operations
- Asynchronous background operations
- Graceful shutdown
- Database rotation and archival
This chapter covers these operational aspects that are critical for production XRPL nodes.
Core Database Interface
The Database class provides higher-level operations above Backend:
Key Responsibilities:
class Database {
public:
    // Synchronous operations
    std::shared_ptr<NodeObject> fetchNodeObject(
        uint256 const& hash,
        std::uint32_t ledgerSeq = 0);

    void store(std::shared_ptr<NodeObject> const& obj);

    void storeBatch(std::vector<std::shared_ptr<NodeObject>> const& batch);

    // Asynchronous operations
    void asyncFetch(
        uint256 const& hash,
        std::function<void(std::shared_ptr<NodeObject>)> callback);

    // Management
    void open(std::string const& path);
    void close();

    // Metrics and diagnostics
    Json::Value getCountsJson() const;
};
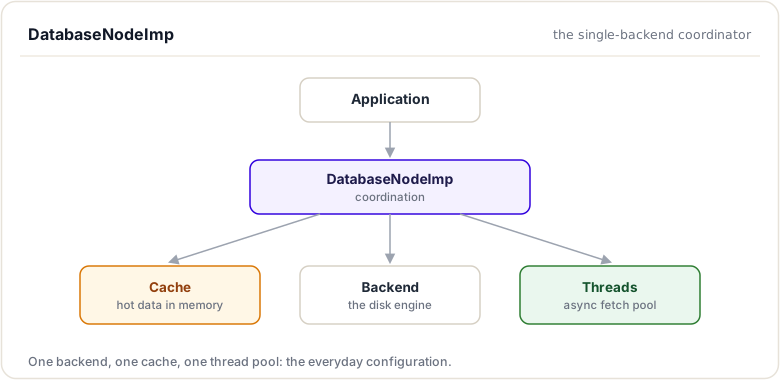
DatabaseNodeImp: Single Backend Implementation
The standard implementation for most XRPL validators:
Architecture:
Storage Flow:
void DatabaseNodeImp::store(std::shared_ptr<NodeObject> const& obj) {
    // Step 1: Update cache immediately (likely reaccess soon)
    {
        std::lock_guard<std::mutex> lock(mCacheLock);
        mCache.insert(obj->getHash(), obj);
    }

    // Step 2: Encode to persistent format
    Blob encoded = encodeObject(obj);

    // Step 3: Persist to backend
    Status status = mBackend->store(obj->getHash(), encoded);

    if (status != Status::ok) {
        // Log error but don't crash
        // Backend error doesn't lose data (already in cache)
        logError("Backend store failed", status);
    }

    // Step 4: Update metrics
    mMetrics.bytesWritten += encoded.size();
    mMetrics.objectsWritten++;
}
Fetch Flow:
std::shared_ptr<NodeObject> DatabaseNodeImp::fetchNodeObject(
    uint256 const& hash,
    uint32_t ledgerSeq)
{
    // Step 1: Check cache
    {
        std::lock_guard<std::mutex> lock(mCacheLock);
        auto cached = mCache.get(hash);
        if (cached) {
            mMetrics.cacheHits++;
            return cached;
        }
    }

    // Step 2: Query backend (potentially slow)
    Blob encoded;
    Status status = mBackend->fetch(hash, encoded);

    std::shared_ptr<NodeObject> result;
    if (status == Status::ok) {
        result = decodeObject(hash, encoded);
    } else if (status == Status::notFound) {
        // Not found - cache dummy to prevent retry
        result = nullptr;
    } else {
        // Backend error
        logWarning("Backend fetch error", status);
        return nullptr;
    }

    // Step 3: Update cache
    {
        std::lock_guard<std::mutex> lock(mCacheLock);
        if (result) {
            mCache.insert(hash, result);
        } else {
            mCache.insertDummy(hash);
        }
    }

    // Step 4: Update metrics
    mMetrics.cacheMisses++;
    mMetrics.bytesRead += encoded.size();

    return result;
}
Batch Operations
Batch operations improve efficiency:
Batch Store:
void DatabaseNodeImp::storeBatch(
    std::vector<std::shared_ptr<NodeObject>> const& batch)
{
    // Step 1: Update cache for all objects
    {
        std::lock_guard<std::mutex> lock(mCacheLock);
        for (auto const& obj : batch) {
            mCache.insert(obj->getHash(), obj);
        }
    }

    // Step 2: Encode all objects
    std::vector<std::pair<uint256, Blob>> encoded;
    encoded.reserve(batch.size());
    for (auto const& obj : batch) {
        encoded.emplace_back(obj->getHash(), encodeObject(obj));
    }

    // Step 3: Store atomically in backend
    Status status = mBackend->storeBatch(encoded);

    // Step 4: Update metrics
    for (auto const& [hash, blob] : encoded) {
        mMetrics.bytesWritten += blob.size();
    }
    mMetrics.objectsWritten += batch.size();
}
Benefits:
Without batch:
  Write 1000 objects → 1000 backend transactions
  1000 disk I/O operations

With batch:
  Write 1000 objects → 1 backend transaction
  1 disk I/O operation (atomic write)

Throughput improvement: 10-50x depending on backend
Batch Size Limits:
static const size_t BATCH_WRITE_PREALLOCATE_SIZE = 256;
static const size_t BATCH_WRITE_LIMIT_SIZE = 65536;

// Prevents:
// 1. Memory exhaustion (unbounded batches)
// 2. Transaction timeout (backend transaction too large)
// 3. Excessive latency (batching too much)
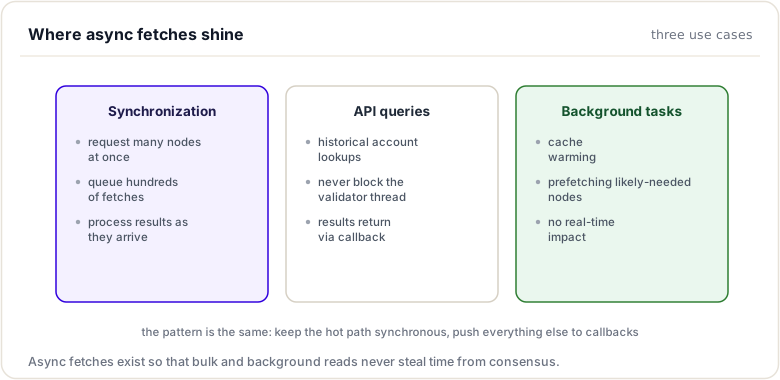
Asynchronous Operations
Background threads handle expensive operations without blocking:
Asynchronous Fetch:
void DatabaseNodeImp::asyncFetch(
    uint256 const& hash,
    std::function<void(std::shared_ptr<NodeObject>)> callback)
{
    // Step 1: Queue request
    mAsyncQueue.enqueue({hash, callback});

    // Step 2: Background thread processes
    // Wakes up, dequeues batch, fetches, invokes callbacks
    // Meanwhile, caller continues without blocking
}

// Thread pool implementation
void asyncWorkerThread() {
    while (running) {
        // Wait for work or timeout
        auto batch = mAsyncQueue.dequeueBatch(timeout);

        if (batch.empty()) {
            continue;
        }

        // Fetch all in batch (more efficient)
        std::vector<uint256> hashes;
        for (auto const& [hash, callback] : batch) {
            hashes.push_back(hash);
        }

        auto results = mBackend->fetchBatch(hashes);

        // Invoke callbacks
        for (auto const& [hash, callback] : batch) {
            auto result = results[hash];
            callback(result);
        }
    }
}
Use Cases:
Initialization and Shutdown
Startup Sequence:
void DatabaseNodeImp::open(DatabaseConfig const& config) {
    // Step 1: Parse configuration
    std::string backend_type = config.get<std::string>("type");
    std::string database_path = config.get<std::string>("path");

    // Step 2: Create backend instance
    mBackend = createBackend(backend_type, database_path);

    // Step 3: Open backend (connects to database)
    Status status = mBackend->open();
    if (status != Status::ok) {
        throw std::runtime_error("Failed to open database");
    }

    // Step 4: Allocate cache
    size_t cache_size_mb = config.get<size_t>("cache_size");
    mCache.setMaxSize(cache_size_mb * 1024 * 1024);

    // Step 5: Start background threads
    int num_threads = config.get<int>("async_threads", 4);
    for (int i = 0; i < num_threads; ++i) {
        mThreadPool.emplace_back([this] { asyncWorkerThread(); });
    }

    // Step 6: Optional: import from another database
    if (config.has("import_db")) {
        importFromDatabase(config.get<std::string>("import_db"));
    }

    // Step 7: Ready for operations
    mReady = true;
}
Shutdown Sequence:
void DatabaseNodeImp::close() {
    // Step 1: Stop accepting new operations
    mReady = false;

    // Step 2: Wait for in-flight async operations to complete
    mAsyncQueue.stop();
    for (auto& thread : mThreadPool) {
        thread.join();
    }

    // Step 3: Flush any pending writes
    // (Most backends buffer writes)
    mBackend->flush();

    // Step 4: Clear cache (will be regenerated on restart)
    mCache.clear();

    // Step 5: Close backend database
    Status status = mBackend->close();
    if (status != Status::ok) {
        logWarning("Backend close not clean", status);
    }
}
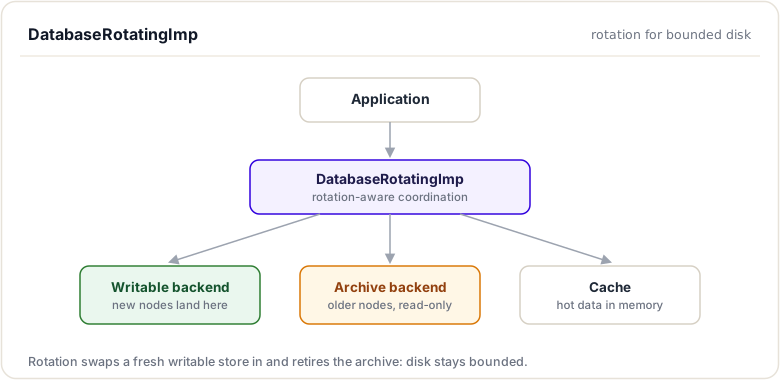
DatabaseRotatingImp: Advanced Rotation
For production systems needing online deletion:
Problem Solved:
Without deletion, database grows unbounded:
Each ledger adds new nodes
Over time: thousands of gigabytes
Eventually: disk full
Options:
  1. Stop validator (unacceptable)
  2. Manual pruning (requires downtime)
  3. Rotation (online deletion)
Rotation Architecture:
Rotation Process:
void DatabaseRotatingImp::rotate() {
    // Step 1: Stop writes to current backend
    auto old_writable = mWritableBackend;
    auto old_archive = mArchiveBackend;

    // Step 2: Create new writable backend
    mWritableBackend = createNewBackend();
    mWritableBackend->open();

    // Step 3: Transition current writable → archive
    mArchiveBackend = old_writable;

    // Step 4: Delete old archive (in background)
    deleteBackendAsync(old_archive);

    // Step 5: Copy critical data if needed
    // (e.g., ledger headers required for validation)
    copyCriticalData(old_archive, mWritableBackend);

    // Step 6: Continue operation with no downtime
}
Dual Fetch Logic:
std::shared_ptr<NodeObject> DatabaseRotatingImp::fetchNodeObject(
    uint256 const& hash,
    uint32_t ledgerSeq,
    bool duplicate)
{
    // Check cache first
    auto cached = mCache.get(hash);
    if (cached) {
        return cached;
    }

    // Try writable (current ledgers)
    auto obj = mWritableBackend->fetch(hash);
    if (obj) {
        mCache.insert(hash, obj);
        return obj;
    }

    // Try archive (older ledgers)
    obj = mArchiveBackend->fetch(hash);
    if (obj) {
        mCache.insert(hash, obj);

        // Optionally duplicate to writable for longevity
        if (duplicate) {
            mWritableBackend->store(hash, obj);
        }

        return obj;
    }

    return nullptr;
}
Benefits:
With rotation:
  Ledger 1000000: stored in Writable
  Ledger 1000001-1100000: stored in Writable
  Ledger 900000-999999: stored in Archive

  Ledger 900000: Delete ledger → Keep recent 100k only
  Old archive deleted → Disk space reclaimed

  No downtime, no backups needed, bounded growth
Metrics and Monitoring
NodeStore exposes comprehensive metrics for monitoring:
struct NodeStoreMetrics {
    // Storage metrics
    uint64_t objectsWritten;
    uint64_t bytesWritten;
    std::chrono::microseconds writeLatency;

    // Retrieval metrics
    uint64_t objectsFetched;
    uint64_t cacheHits;
    uint64_t cacheMisses;
    uint64_t bytesFetched;
    std::chrono::microseconds fetchLatency;

    // Cache metrics
    size_t cacheObjects;
    double cacheHitRate() const {
        return cacheHits / (double)(cacheHits + cacheMisses);
    }

    // Threading metrics
    size_t asyncQueueDepth;
    int activeAsyncThreads;
};
Monitoring Typical Values:
Hit rate: 92-96% (well-configured systems)
Write latency: 0.1-1 ms per object
Fetch latency: 0.01-0.1 ms per object (mostly cache hits)
Cache size: 128MB - 2GB
Async queue depth: 0-100 (queue length)
Alert Thresholds:
If hit rate < 80%:        Cache too small or thrashing
If write latency > 10ms:   Backend I/O struggling
If queue depth > 10000:    Not keeping up with load
If fetch latency > 100ms:  Serious performance issue
Appendix: Debugging and Development Tools
Introduction
This appendix provides techniques and tools for investigating SHAMap and NodeStore behavior.
Logging and Diagnostics
Enable Verbose Logging
Edit xrpld.cfg:
[rpc_startup]
{ "command": "log_level", "severity": "debug" }
Then restart rippled and check logs:
tail -f /var/log/rippled/rippled.log | grep -i nodestore
Key Log Messages
TRACE Ledger:        Ledger opened/closed
DEBUG SHAMap:        Tree operations
DEBUG NodeStore:     Database operations
INFO  Consensus:     Validation and agreement
WARN  Performance:   Slow operations detected
Metrics Inspection
JSON-RPC Inspection
# Get storage metrics
xrpld server_info | jq '.result.node_db'

# Expected output:
{
  "type": "RocksDB",
  "path": "/var/lib/rippled/db/rocksdb",
  "cache_size": 256,
  "cache_hit_rate": 0.923,
  "writes": 1000000,
  "bytes_written": 1000000000,
  "reads": 50000000,
  "cache_hits": 46150000,
  "read_latency_us": 15
}
File System Inspection
# Check database size
du -sh /var/lib/rippled/db/*

# Monitor growth
watch -n 1 'du -sh /var/lib/rippled/db/*'

# Check free space
df -h /var/lib/rippled/

# Monitor I/O
iostat -x 1 /dev/sda
Debugging Specific Issues
Issue: Cache Hit Rate Too Low
Symptoms:
- Database queries slow
- Ledger close times increasing
- Hit rate < 80%
Investigation:
# Check cache metrics
xrpld server_info | jq '.result.node_db.cache_hit_rate'

# Check cache size configuration
grep cache_size xrpld.cfg

# Monitor cache evictions
tail -f /var/log/rippled/rippled.log | \
  grep -i "evict\|cache"
Solutions:
- Increase
cache_sizeif memory available - Reduce
cache_agefor faster eviction of cold data - Check if system is memory-constrained (use
free)
Issue: Write Performance Degradation
Symptoms:
- Ledger closes slow (>10 seconds)
- Database write errors in logs
- Validator falling behind network
Investigation:
# Check write latency
xrpld server_info | \
  jq '.result.node_db.write_latency_us'

# Monitor disk I/O
iotop -o -b -n 1

# Check disk space
df -h

# Monitor async queue
tail /var/log/rippled/rippled.log | \
  grep -i "async.*queue"
Solutions:
- Ensure SSD (not HDD) for database
- Check disk I/O isn't saturated
- Increase
async_threadsif I/O bound - Switch to faster backend (NuDB vs RocksDB)
- Enable compression if disk is bottleneck
Issue: Synchronization Slow
Symptoms:
- New nodes take hours to sync
- Falling behind network
- High database query count
Investigation:
# Monitor sync progress
xrpld server_info | jq '.result.ledger.ledger_index'

# Track fetch operations
tail -f /var/log/rippled/rippled.log | \
  grep -i "fetch\|sync"

# Monitor thread pool
ps -p $(pidof rippled) -L

# Check queue depths
xrpld server_info | jq '.result.node_db.async_queue_depth'
Solutions:
- Increase cache size for better hit rate during sync
- Increase
async_threads(more parallel fetches) - Use faster SSD
- Check network bandwidth (might be bottleneck)
- Switch to NuDB for higher throughput
Code Debugging
Building with Debug Symbols
cd rippled
mkdir build
cd build
cmake -DCMAKE_BUILD_TYPE=Debug ..
make -j4
GDB Debugging
# Run under GDB
gdb --args xrpld --conf /path/to/xrpld.cfg

# Inside GDB:
(gdb) run
(gdb) break SHAMap::addKnownNode
(gdb) continue

# When breakpoint hit:
(gdb) print node->getHash()
(gdb) print nodeID
(gdb) step
(gdb) quit
Common Breakpoints
// Node addition
break SHAMap::addKnownNode
break Database::store

// Cache operations
break TaggedCache::get
break TaggedCache::insert

// Synchronization
break SHAMap::getMissingNodes
break NodeStore::fetchNodeObject
Print Useful Data
(gdb) print node->getHash().hex()
(gdb) print nodeID.mDepth
(gdb) print nodeID.mNodeID.hex()
(gdb) print metrics.cacheHits
(gdb) print metrics.cacheMisses
Performance Profiling
CPU Profiling with Perf
# Record 60 seconds of system behavior
perf record -F 99 -p $(pidof rippled) -- sleep 60

# Analyze results
perf report

# Show flame graph
perf record -F 99 -p $(pidof rippled) -- sleep 60
perf script | stackcollapse-perf.pl | flamegraph.pl > profile.svg
Memory Profiling with Valgrind
# Run under memcheck (very slow)
valgrind --leak-check=full xrpld --conf xrpld.cfg

# Run specific test
valgrind --leak-check=full xrpld --unittest test.nodestore
Custom Instrumentation
Add to rippled source:
// In Database::fetchNodeObject
auto startTime = std::chrono::steady_clock::now();

auto obj = mBackend->fetch(hash);

auto elapsed = std::chrono::steady_clock::now() - startTime;
auto ms = std::chrono::duration_cast<std::chrono::milliseconds>(elapsed);

if (ms.count() > 100) {
    JLOG(mLog.warning()) << "Slow fetch: " << hash.hex()
                        << " took " << ms.count() << "ms";
}
Test-Driven Debugging
Running Unit Tests
# Build with tests enabled
cd rippled/build
cmake -Dtests=ON ..

# Run all tests
ctest

# Run specific test
ctest -R "shamap" -V

# Run single test file
./bin/xrpld --unittest test.SHAMap
Writing Debug Tests
// Shape of the suites in src/test/nodestore/ (beast::unit_test)
class MyDebug_test : public beast::unit_test::Suite
{
public:
    void
    run() override
    {
        testcase("Debug specific case");

        auto shamap = std::make_shared<SHAMap>(/* ... */);
        shamap->addRootNode(/* ... */);

        auto const node = shamap->getNode(hash);
        BEAST_EXPECT(node != nullptr);
        BEAST_EXPECT(node->getHash() == expectedHash);
    }
};

BEAST_DEFINE_TESTSUITE(MyDebug, nodestore, xrpl);
Useful Commands
Check Configuration
grep -E "^[a-z]|^\[" xrpld.cfg | head -30
Monitor in Real Time
# CPU/Memory
top -p $(pidof rippled)

# Disk I/O
iotop -p $(pidof rippled)

# Network traffic
netstat -an | grep ripple

# File descriptors
lsof -p $(pidof rippled) | wc -l
Database Inspection
For RocksDB:
# Use RocksDB tools
rocksdb_ldb --db=/var/lib/rippled/db/rocksdb scan

# List files
ls -lah /var/lib/rippled/db/rocksdb/
Log Analysis
# Count errors
grep ERROR /var/log/rippled/rippled.log | wc -l

# Find slow operations
grep "took.*ms" /var/log/rippled/rippled.log

# Timeline of events
tail -f /var/log/rippled/rippled.log | \
  awk '{print $1" "$2" "$3" "$4" ..."}'
Performance Regression Testing
Benchmark Before/After
# Get baseline
xrpld --unittest test.SHAMap > baseline.txt 2>&1

# Modify code...

# Test after change
xrpld --unittest test.SHAMap > modified.txt 2>&1

# Compare
diff baseline.txt modified.txt
Load Testing
# Submit transactions and measure
./load_test.sh --transactions 1000 --duration 60

# Monitor metrics
watch -n 1 'xrpld server_info | jq ".result.node_db"'
Common Issues and Solutions
| Issue | Investigation | Solution |
|---|---|---|
| High cache miss rate | Cache metrics | Increase cache_size |
| Slow sync | Fetch latency | Increase async_threads |
| Disk full | df -h | Enable online_delete |
| Memory leak | Valgrind | Fix code (likely nodes not freed) |
| Hang on startup | strace | Check database corruption |
| Consensus failing | Logs for validation errors | Check NodeStore consistency |
See the Codebase navigation module to find the files mentioned here.
Summary
This module looked at where and how the NodeStore actually stores data. You compared the real backends, NuDB and RocksDB, and traced the fetch, store, batch, and asynchronous operations that move data in and out. You also saw online deletion (database rotation), the mechanism that bounds a node's disk by dropping ledger history it no longer needs.
To remember:
- Two production backends: NuDB (append-only, constant-time fetch, SSD-friendly) and RocksDB (LSM tree)
- Operations: fetch / store / batch / async, implemented by
DatabaseNodeImp - Online deletion (rotation):
online_delete+advisory_deletekeep disk usage bounded - Backend files live under the
[node_db]path= - Switching engines = change
type=and resync (or use the import tool); data does not convert in place - Batch writes amortize I/O; async fetches keep sync fast
- Tests to study:
src/test/nodestore - Watch out: changing
type=while keeping the oldpath=leaves the old data stranded and the node starts empty
Next up. Disks are slow and consensus will not wait. Next: the caching layers that keep a 3-second ledger cycle fed from microsecond memory.
Resources
Assignments
0 of 2 complete